
Key Takeaways
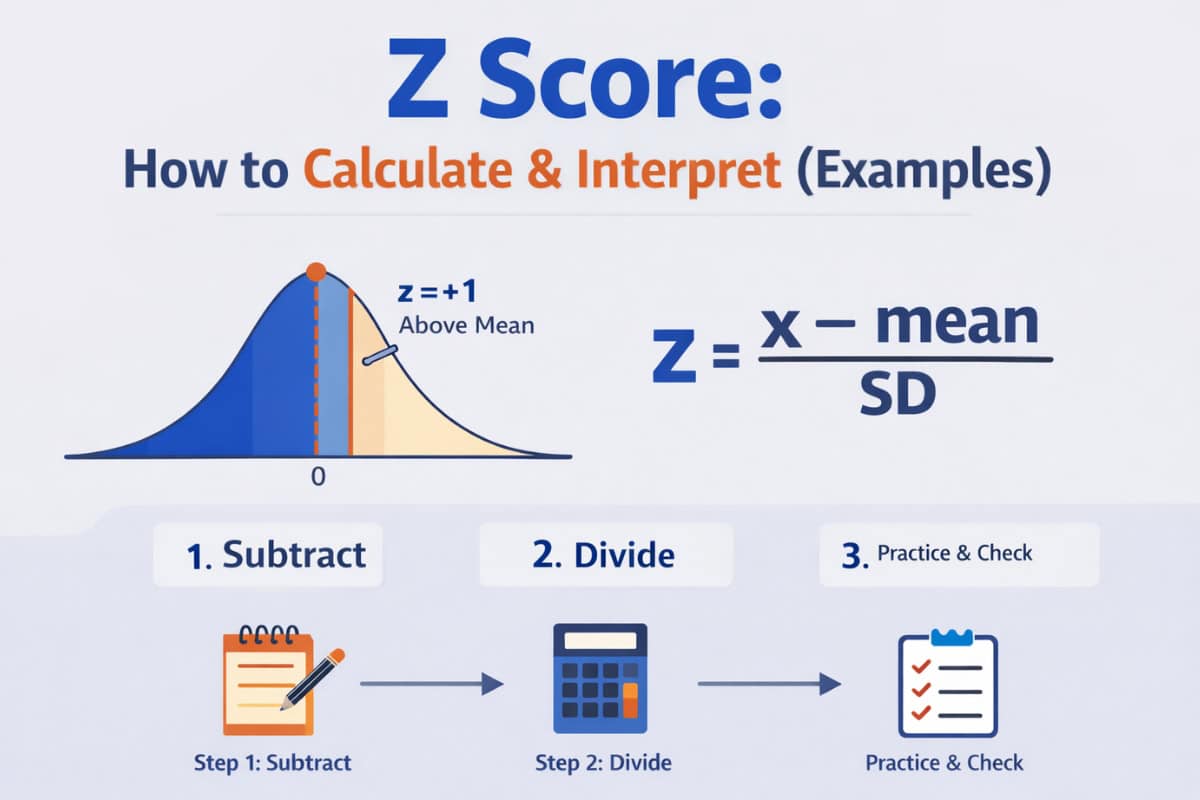
- A z score tells how many standard deviations (typical spread) a value is from the mean.
- Use . Keep the sign (+/−).
- z-scores help you compare values from different groups.
Your z score is the first thing teachers want when they say “standardize this value.” You’ll learn one simple method and see worked examples. You’re not behind. You just need a clear method.

Quick answer
A z score tells how far a value is from the mean, measured in standard deviations.
Use this formula: (population) or (sample).
Step 1: subtract the mean. Step 2: divide by the standard deviation.
Positive z means “above the mean.” Negative z means “below the mean.”
What is a z score?
A z score (standard score) is the number of standard deviations a value is above or below the mean.
Key words
- Mean (average value).
- Standard deviation (how spread out the data is).
- Standardize (convert to a common scale).
- Normal distribution (bell-shaped pattern).
- Standard normal (a normal curve with mean 0 and SD 1).
The z score formula (and what symbols mean)
| Symbol | Means | Plain-English meaning |
|---|---|---|
| data value | the score you’re converting | |
| population mean | true average (whole group) | |
| population SD | true spread (whole group) | |
| sample mean | average of your sample | |
| sample SD | spread of your sample | |
| z score | “how many SDs away” |
Most homework uses the sample version: .
How to read z score
- Positive z score (+) → the value is above the average
Example: z = +1 means the score is 1 standard deviation higher than the average. - Zero (0) → the value is exactly at the average
- Negative z score (−) → the value is below the average
Example: z = −2 means the score is 2 standard deviations lower than the average.
Why we use z scores
- To compare fairly. You can compare scores from different tests or groups.
(Example: 85 in Math vs. 90 in English — z scores show which is better relative to each class.) - To see how unusual a value is.
A z near 0 = common.
A z near ±2 or ±3 = rare or extreme. - To understand position in the data.
It shows if you are below average, average, or above average — and by how much.
In short: a z score answers, “Where does this value stand compared to everyone else?”


How to calculate a z score (step-by-step)
Step-by-step method
- Write the formula you will use.
- Population:
- Sample:
- Plug in numbers for x, mean, and SD.
- Subtract:
- Divide by SD.
- Round the way your teacher wants (often 2 decimals).
What to write on your paper
- ✅ Formula used (population or sample)
- ✅ Subtraction line:
- ✅ Divide by the standard deviation (s or σ).
- ✅ Final z score with sign (+/−)
Quick self-check (to verify your answer)
- If is above the mean, z should be positive.
- If is below the mean, z should be negative.
- If mean, then .

Worked examples
Example 1 (very easy)
Mean , SD , value .
Answer:
Why: 60 is 1 SD above 50.
Example 2 (typical homework)
A quiz score is . Class mean . Class SD
Answer:
Meaning: 72 is 1 SD above the class average.
Example 3 (negative z score)
Heights: mean , SD . You are
Answer:
Why: 148 is below the mean, so z must be negative.
Example 4 (common “trick”: choose the right SD)
A data set has mean =20.
- If SD =4 and x=28, then z=428−20=2.
- If SD =8 and x=28, then z=828−20=1.
Point: Same x, different SD → different z. SD controls the scale.



Practice set (with answer key)
Directions: Find the z score. Round to 2 decimals.
- Mean=30, SD=5,
- Mean=30, SD=5,
- , ,
- , , (trap: don’t overthink)
- Mean=200, SD=20,
- , ,
- Mean=10, SD=2,
- Mean=100, SD=25,
Answer key
Short solutions (2 items only):
- #5:
- #6:

Common mistakes
| Mistake | Why it happens | Do this instead |
|---|---|---|
| Forgetting the negative sign | You subtract in the wrong order | Always do , not mean − x. |
| Using the wrong SD (sample vs population) | Both formulas look similar | If the problem gives and , use the sample formula. |
| Dividing before subtracting | Rushing | Do it in order: subtract first, then divide. |
| Thinking z must be between −1 and 1 | Confusing z with probability | z can be any real number (like 2.4, −3.1). |
| Rounding too early | Small rounding errors grow | Keep extra decimals, round at the end. |
| Mixing units | Mean/SD in one unit, x in another | Match units first (cm with cm, minutes with minutes). |

If you get stuck…
- “I don’t know what formula to use.”
If you see → population. If you see → sample. - “My answer is negative but it shouldn’t be.”
Check: is below the mean? If yes, negative is correct. - “I keep mixing up steps.”
Say it out loud: “Subtract the mean. Divide by SD.” - “My calculator gives a different value.”
Check parentheses: type . - “My z score is huge.”
Re-check SD. A tiny SD can make z look big. - When to review prerequisites:
If “standard deviation” feels unclear, review that first (see Next steps). - When to ask for help:
If your class uses a special rounding rule or a special SD formula, ask your teacher or tutor. That’s normal.

Next steps
- Z-score calculator — check homework fast and reduce arithmetic errors.
- z score to percentile — learn how to turn z into a percentile rank (great for normal curve questions).
- percentile to z score — go the other direction (common in exam problems).
- standard deviation — strengthen the skill that controls the whole z-score scale.
How we know
- z-score meaning and sign rules match standard intro statistics explanations (how many SDs from the mean).
- Both sample and population forms are shown the way university stats lessons present them.
- Steps were checked against worked examples and standard interpretations (positive above mean, negative below).
- Definitions align with widely used open textbooks and education platforms.
Use this the right way
Use z scores to understand your work, not to copy answers. Try the steps first, then check with a calculator. If you use z scores in a research paper, cite your sources and explain what your numbers mean in words.
Study tools that can help
- If you make sign mistakes often: use the Z-score calculator after you do it by hand once.
- If you get overwhelmed: use a simple homework checklist (one page) and tick each step.
- If you’re time-crunched: do 3 practice items daily (not 30 in one night). Consistency helps more than cramming (no promises—just a better study habit).
References
OpenStax. (2020). 6.1 The standard normal distribution. In Statistics. Rice University. https://openstax.org/books/statistics/pages/6-1-the-standard-normal-distribution
National Institute of Standards and Technology. (2012). ISO 13528 ZSCORE (Dataplot reference manual). https://www.itl.nist.gov/div898/software/dataplot/refman2/auxillar/zscore.htm


