

Key Takeaways
- Summary statistics tell the “story” of your data using a few key numbers.
- Use median + IQR when data is skewed or has outliers.
- A simple report = n, center, spread, five-number summary, and outliers (if any).
Summary statistics can feel like “too many formulas at once.”
You’ll learn a simple method, what to write on your paper, and see worked examples.

Quick answer
Summary statistics are numbers that summarize a dataset: the center (mean/median), spread (range/SD/IQR), and position (quartiles).
If your data has outliers, report median and IQR, and flag possible outliers using the 1.5×IQR rule.
Fast steps: (1) Sort, (2) find n, min, max, (3) find median and quartiles, (4) compute IQR, (5) check outliers, (6) choose mean vs median, (7) write a 1–2 sentence summary.
What are summary statistics?
Summary statistics (numbers that describe your data) help you report the “big picture” without listing every value.
They usually include:
- n (how many values)
- Center: mean (average) and/or median (middle value)
- Spread: range (max − min), standard deviation (typical spread), and/or IQR (middle-half spread)
- Five-number summary: min, Q1, median, Q3, max
- Outliers (values far from the rest), often checked with the 1.5×IQR rule
Key terms (quick definitions)
- Mean (average value).
- Median (middle value after sorting).
- Quartiles (cut points that split sorted data into quarters).
- IQR (interquartile range = Q3 − Q1).
- Standard deviation (how far values are from the mean, in a typical way).
- Outlier (a value that may be unusually far from the rest).

What to report (pick the right measures)
| Data situation | What to report | Optional (if required) | Why this works |
|---|---|---|---|
| Data looks balanced (not very skewed) | Mean + standard deviation (or Mean + range) | Min and max (if your teacher wants them) | Mean describes the center well when values are fairly even; SD/range shows spread. |
| Data is skewed or has outliers | Median + IQR; Five-number summary; Possible outliers using the 1.5×IQR rule | List the outlier fences: Q1 − 1.5×IQR, Q3 + 1.5×IQR | The mean can shift a lot from one extreme value; the median is more resistant (less affected). |
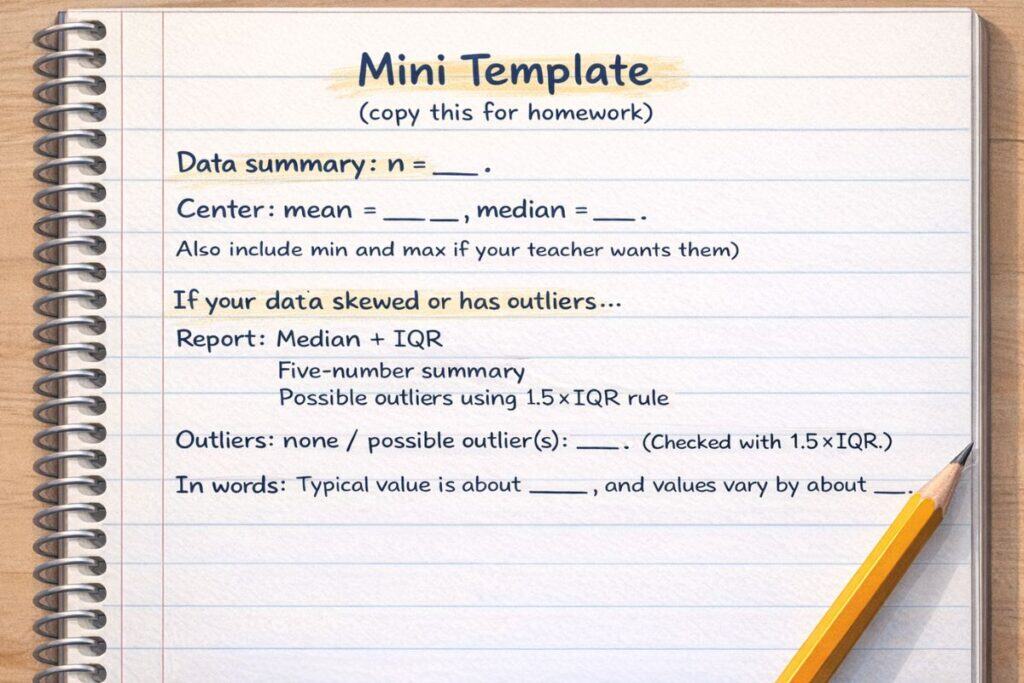
Mini template (copy this for homework)
Fill in the blanks:
Data summary: n = ___ .
Center: mean = ___, median = ___ .
Spread: range = ___ (min = ___, max = ___), and (SD = ___ / IQR = ).
Five-number summary: (, ___, ___, ___, ___).
Outliers: none / possible outlier(s): ___. (Checked with 1.5×IQR.)
In words: Typical value is about ___, and values vary by about ___.

Step-by-step method
Step 1: Sort the data
Write: Sorted: …
Step 2: Write the basics
- n = number of values
- min and max
- range = max − min
Step 3: Find the median (Q2)
- If n is odd: median is the middle value.
- If n is even: median is the average of the two middle values.
Step 4: Find Q1 and Q3
- Split into a lower half and upper half (after sorting).
- Q1 = median of the lower half.
- Q3 = median of the upper half.
(Teachers may use different quartile rules, so follow your class method.)
Step 5: Compute IQR
IQR = Q3 − Q1
Step 6: Check for outliers (1.5×IQR rule)
- Lower fence = Q1 − 1.5×IQR
- Upper fence = Q3 + 1.5×IQR
Values outside the fences are possible outliers.
Step 7: Choose what to report
- Balanced data → mean + SD
- Skew/outliers → median + IQR + five-number summary
What to write on your paper (mini-checklist)
- Sorted list (or say “sorted”)
- n, min, max, range
- median (Q2)
- Q1 and Q3
- IQR
- fences + outliers (if asked)
- 1–2 sentence interpretation
Quick self-check
- Did you sort before median and quartiles?
- Is Q1 ≤ median ≤ Q3?
- Is IQR non-negative?
- Do your fences make sense (lower fence should be ≤ upper fence)?

Worked examples
Example 1 (very easy)
Data: 4, 6, 8, 10
- Sorted: 4, 6, 8, 10
- n = 4, min = 4, max = 10, range = 10 − 4 = 6
- Median = (6 + 8) / 2 = 7
- Lower half: 4, 6 → Q1 = (4 + 6)/2 = 5
Upper half: 8, 10 → Q3 = (8 + 10)/2 = 9 - IQR = 9 − 5 = 4
- Fences:
- Lower = 5 − 1.5(4) = 5 − 6 = −1
- Upper = 9 + 6 = 15
No outliers (all values are between −1 and 15).
What to report (simple): median = 7, IQR = 4, min = 4, max = 10.
Example 2 (typical homework: one outlier)
Data: 10, 11, 11, 12, 50
- Sorted: 10, 11, 11, 12, 50
- n = 5, min = 10, max = 50, range = 40
- Median (middle) = 11
- Lower half: 10, 11 → Q1 = (10 + 11)/2 = 10.5
Upper half: 12, 50 → Q3 = (12 + 50)/2 = 31 - IQR = 31 − 10.5 = 20.5
- Fences:
- Lower = 10.5 − 1.5(20.5) = 10.5 − 30.75 = −20.25
- Upper = 31 + 30.75 = 61.75
No outliers by the fence rule here (50 is still inside).
But notice: the data is very skewed because of 50. In a class summary, you would still prefer median + IQR and show the five-number summary.
Five-number summary: (10, 10.5, 11, 31, 50)
Example 3 (exam-style: outlier flagged)
Data: 2, 3, 3, 4, 4, 5, 6, 30
- Sorted: 2, 3, 3, 4, 4, 5, 6, 30
- n = 8, min = 2, max = 30, range = 28
- Median = (4 + 4)/2 = 4
- Lower half: 2, 3, 3, 4 → Q1 = (3 + 3)/2 = 3
Upper half: 4, 5, 6, 30 → Q3 = (5 + 6)/2 = 5.5 - IQR = 5.5 − 3 = 2.5
- Fences:
- Lower = 3 − 1.5(2.5) = 3 − 3.75 = −0.75
- Upper = 5.5 + 3.75 = 9.25
30 is above 9.25 → possible outlier.
Report: median = 4, IQR = 2.5, five-number summary = (2, 3, 4, 5.5, 30), outlier: 30 (by 1.5×IQR).


Practice set (with answer key)
Directions: For each item, write “Sorted:” first, then compute the statistic(s) asked.
- Median: middle value (or average of the 2 middle values).
- Range: max − min.
- Mean: sum ÷ n.
- Mode: most frequent value.
- Outlier check (IQR fences):
- IQR = Q3 − Q1
- Lower fence = Q1 − 1.5×IQR
- Upper fence = Q3 + 1.5×IQR
Questions
- Find the median and range for: 5, 7, 9
- Find the mean and median for: 2, 2, 2, 8
- Find the median and mode for: 1, 3, 3, 3, 10
- Find the median, minimum, and maximum for: 4, 4, 6, 8, 8, 10
- Find the median for: 12, 15, 15, 18, 21, 21, 21, 25
- Outlier check (use IQR fences): Is 40 a possible outlier in
3, 3, 4, 4, 5, 6, 7, 40? - Find the mean and median for: 10, 11, 12, 13, 14, 15
- Find the mode and range for: 1, 2, 2, 2, 3, 9
Answer key
- Sorted: 5, 7, 9
Median = 7, Range = 9 − 5 = 4 - Sorted: 2, 2, 2, 8
Mean = (2+2+2+8)/4 = 14/4 = 3.5, Median = (2+2)/2 = 2 - Sorted: 1, 3, 3, 3, 10
Median = 3, Mode = 3 - Sorted: 4, 4, 6, 8, 8, 10
Median = (6+8)/2 = 7, Min = 4, Max = 10 - Sorted: 12, 15, 15, 18, 21, 21, 21, 25
Median = (18+21)/2 = 19.5 - Sorted: 3, 3, 4, 4, 5, 6, 7, 40
Likely outlier: 40 (check with fences) - Sorted: 10, 11, 12, 13, 14, 15
Mean = (10+11+12+13+14+15)/6 = 75/6 = 12.5, Median = (12+13)/2 = 12.5 - Sorted: 1, 2, 2, 2, 3, 9
Mode = 2, Range = 9 − 1 = 8
Two short solutions (worked)
#2 Mean and median: Sorted: 2, 2, 2, 8
- Mean = (2+2+2+8)/4 = 14/4 = 3.5
- Median = (2nd + 3rd)/2 = (2+2)/2 = 2
#6 Outlier check (IQR fences): Sorted: 3, 3, 4, 4, 5, 6, 7, 40
Lower half: 3, 3, 4, 4 → Q1 = (3+4)/2 = 3.5
Upper half: 5, 6, 7, 40 → Q3 = (6+7)/2 = 6.5
IQR = Q3 − Q1 = 6.5 − 3.5 = 3
Upper fence = Q3 + 1.5×IQR = 6.5 + 1.5×3 = 6.5 + 4.5 = 11
Since 40 > 11, 40 is a possible outlier.

Common mistakes
| Common mistake | Why it happens | Do this instead |
|---|---|---|
| Forgetting to sort first. | You rush. | Write “Sorted:” before median/quartiles. |
| Using mean even with an extreme outlier. | Mean is taught first. | If outliers/skew show up, report median + IQR. |
| Mixing up Q1 and “the first number.” | Q1 sounds like “first.” | Q1 is the median of the lower half, not the smallest value. |
| Computing IQR as Q1 − Q3. | Subtraction order slips. | Always do Q3 − Q1. |
| Calling every extreme value an outlier without checking. | It “looks big.” | Use fences: Q1 − 1.5×IQR and Q3 + 1.5×IQR. |
| Rounding too early. | You want a clean answer fast. | Keep extra decimals; round at the end. |
| Not matching your class’s quartile method. | Different calculators use different rules. | Follow your teacher’s method (ask if unsure). |

If you get stuck…
- “I don’t know what to report.”
Quick fix: If outliers/skew → median + IQR + five-number summary. Otherwise → mean + SD. - “My outlier fence seems weird.”
Quick fix: Re-check IQR = Q3 − Q1. Then multiply by 1.5. - “My median changed when I used a calculator.”
Quick fix: Make sure the data was sorted and entered correctly. - “My Q1 and Q3 don’t match my friend’s.”
Quick fix: Quartile methods can differ. Use your class rule. - “My calculator gives different results.”
Quick fix: Check rounding settings and method choices (sample vs population, quartile method).
If you’re still stuck, it’s okay to ask your teacher: “Which quartile method should we use?” That’s a normal question.
Next steps
- Start at the main hub: Statistics Calculators and Study Guides (https://brainmatterslearning.com/statistics/)
- Go deeper in descriptive topics: Descriptive Statistics Calculators and Study Guides (https://brainmatterslearning.com/statistics/descriptive/)
- Use the all-in-one tool for reporting: Descriptive Statistics Calculator (All-in-One) (https://brainmatterslearning.com/statistics/descriptive/descriptive-statistics-calculator/)
- If you only need center: Mean Median Mode Calculator (https://brainmatterslearning.com/statistics/descriptive/mean-median-mode-calculator/)
- For concept clarity: Mean Median Mode: What They Mean, How to Find Them (https://brainmatterslearning.com/mean-median-mode/)
- For neat, organized work: Best high-quality notebooks for math notes (https://brainmatterslearning.com/best-high-quality-notebooks-for-math-notes/)
How we know
- The outlier fence rule (1.5×IQR) matches standard textbook and reference guidance.
- The meaning of standard deviation as a spread measure matches standard intro statistics sources.
- Steps were checked against worked examples and common classroom routines (sort → median/quartiles → IQR → fences).
- We use “possible outlier” language because outliers should be investigated, not blindly deleted.
Use this the right way
Use this guide to learn the method and explain your work.
If this is for a project or paper, cite your sources and write results in your own words.
Don’t copy answers without understanding them.
Evidence rule for claims
When we say “use median + IQR for skew/outliers,” that is based on widely used rules for quartiles/IQR and the 1.5×IQR outlier check.
When evidence depends on class conventions (like quartile method), we say “follow your teacher’s rule” because methods vary.
Study tools that can help
If you get overwhelmed or your work gets messy:
- A clean notebook helps you keep “Sorted / Q1 / Median / Q3” steps in order
- A mechanical pencil helps when you re-write sorted lists and fix small errors
References
OpenStax. (2023). Introductory Statistics 2e: 2.3 Measures of the Location of the Data. https://openstax.org/books/introductory-statistics-2e/pages/2-3-measures-of-the-location-of-the-data
OpenStax. (2023). Introductory Statistics 2e: 2.7 Measures of the Spread of the Data. https://openstax.org/books/introductory-statistics-2e/pages/2-7-measures-of-the-spread-of-the-data
NIST/SEMATECH. (n.d.). e-Handbook of Statistical Methods: What are outliers in the data? https://www.itl.nist.gov/div898/handbook/prc/section1/prc16.htm


