
Percentile rank gets confusing fast when there are ties, different rounding rules, or your teacher’s answer doesn’t match yours.
This tool tells you where a score sits inside a specific dataset (like a class list of test scores). You’ll get the percentile rank plus optional details (counts below/equal/above, rank position, and z-score). It also helps you handle ties consistently—one of the biggest reasons answers differ.
Click Calculate to get the percentile rank and a clear interpretation.
What this means
Enter a target score and dataset, then click Calculate to see what percentile rank means in plain language.
Show steps / formulas
Step 1: Count how many values are below the target score x (call this B),
how many are equal to x (call this E), and the total N.
Step 2: Compute percentile rank (PR) using your chosen tie rule:
- Half ties (recommended):
PR = (B + 0.5E) / N × 100 - Low (strictly below):
PR = B / N × 100 - High (below-or-equal):
PR = (B + E) / N × 100
Rank positions (when ties exist):
rank_min = B + 1
rank_max = B + E
midrank = (rank_min + rank_max) / 2
Optional z-score: If you check “Z-score of x,” this tool also computes z = (x − mean) / SD using the dataset’s sample SD.
When you’re ready to summarize the dataset too, use the Descriptive Statistics Calculator from the Descriptive hub.

What this calculator does
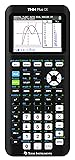
A percentile rank calculator converts a score into a relative position inside a dataset.
It answers:
- “What percent of the values are below this score?”
- “How do I interpret the score’s standing in this group?”
- “What happens if the score appears multiple times (ties)?”
A key idea: percentile rank is about position, not percent correct. It’s a ranking measure used to interpret performance relative to a reference group.



When to use it (and when not to)
Use it when you have:
- A specific dataset (class scores, sample measurements, survey totals)
- A target value x you want to locate in that dataset
- A need to explain “how this score compares” in plain language
Do not use it when:
- You don’t have the reference group data (percentile rank depends on the dataset)
- You’re mixing different groups (e.g., two classes with different tests)
- You actually need a theoretical percentile from a normal curve (that’s a different task—use z-score/normal tools instead)

How it works (simple explanation)
- Sort the dataset from lowest to highest.
- Count:
- B = how many values are below x
- E = how many values are equal to x (ties)
- N = total number of values
- Compute percentile rank using a tie rule. A common classroom convention is the “half ties” method:
This “half ties” approach is widely used because it places tied scores in the middle of their tied block rather than forcing them to the bottom or top.
Step-by-step example
Dataset (12 scores):
55, 60, 61, 70, 72, 72, 75, 78, 80, 81, 85, 90
Target score:
Step 1: Count values below, equal, total
- Below 72: 55, 60, 61, 70 → B = 4
- Equal to 72: 72, 72 → E = 2
- Total values → N = 12
Step 2: Use the “half ties” formula
Interpretation: A percentile rank of 41.67% means the score 72 is higher than about 41.67% of the scores in this dataset (using the half-ties rule).
Common mistakes
- Mixing up percentile rank vs percentile. Percentile rank is a position (a percent of scores below). A percentile is a cutoff value in the distribution.
- Ignoring ties. If x appears more than once, your answer changes depending on the tie rule you use.
- Using the wrong group. Percentile rank is only meaningful relative to the dataset you used.
- Rounding too early. Count first, compute once, then round at the end.
- Interpreting it as an “equal-interval” scale. Percentile ranks are not equal-interval; a 10-point jump doesn’t represent the same score difference everywhere.
FAQs: Percentile Rank Calculator
Why is my answer different from my teacher’s?
Most mismatches come from ties (different tie rules), a different dataset, or different rounding. If your teacher uses “below-or-equal” instead of “half ties,” your percentile rank will be higher when ties exist.
If there are ties, which method should I use?
If your class doesn’t specify a rule, use half ties because it places tied scores in the middle of their tied group and is a common convention, where:
B = how many values are below x
E = how many values are equal to x (ties)
N = total number of values
Is percentile rank the same as percentile?
No. Percentile rank describes a score’s location (“this score is at about the 42nd percentile”). A percentile is a value cutoff (like “the 75th percentile value is 81”).
Which test should I use—percentile rank or z-score?
Use percentile rank when comparing within a specific dataset (your class list). Use a z-score when you need a standardized distance from the mean (especially for comparing across distributions or when using normal-curve tools).
What’s a good sentence to write in my homework?
“The score x is at approximately the PRth percentile in this dataset, meaning it is higher than about PR% of the observed values.”
Can percentile rank be used for small samples?
Yes, but interpret carefully—small N makes percentile ranks jump in larger steps (each data point is a big fraction of the group).
Related BrainMattersLearning statistics tools
Use these when your task changes from “position” to “standardizing” or “summarizing”:
- Z Score Calculator: how many standard deviations a value is from the mean
- Descriptive Statistics Calculator: summarizes the dataset (mean, median, SD, etc.)
References
Illowsky, B., & Dean, S. (2018). Introductory statistics. OpenStax, Rice University. https://openstax.org/details/books/introductory-statistics-2e
National Institute of Standards and Technology. (n.d.). Percentiles (NIST/SEMATECH e-Handbook of Statistical Methods). https://www.itl.nist.gov/div898/handbook/
Sage Publications. (n.d.). Percentile rank (Encyclopedia of Research Design). https://methods.sagepub.com/ency/edvol/sage-encyclopedia-of-educational-research-measurement-evaluation/chpt/percentile-rank